
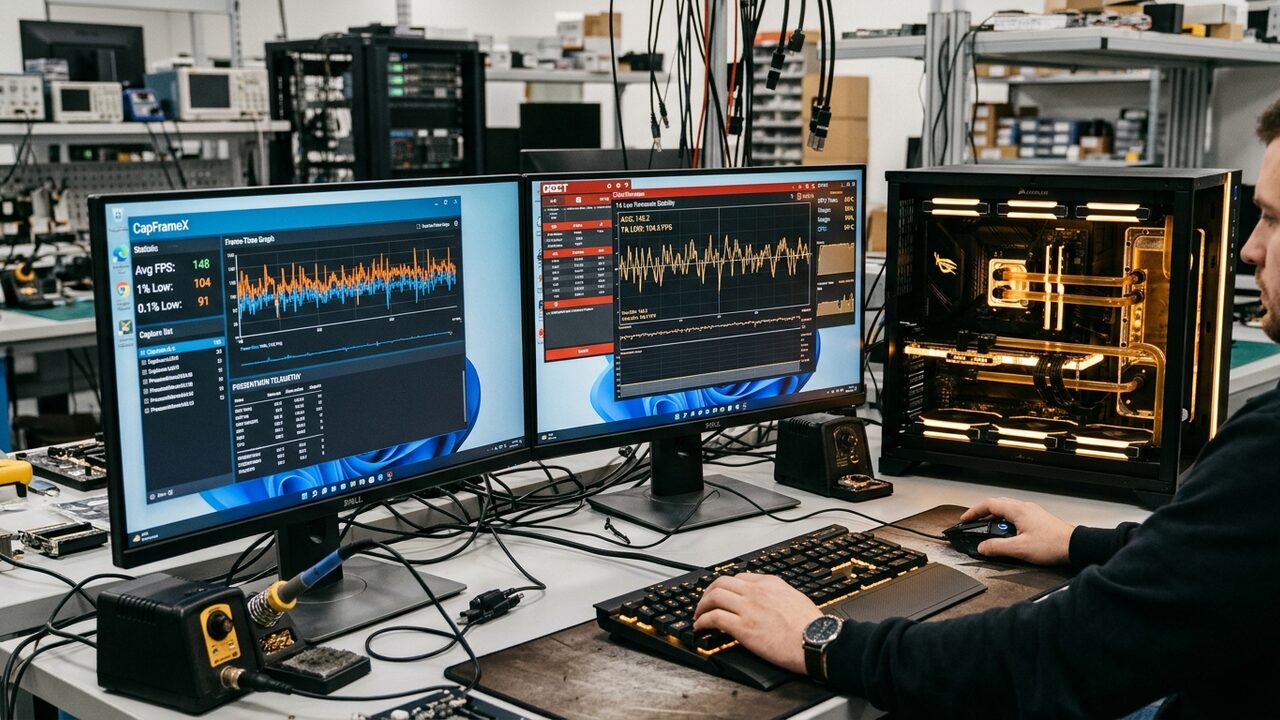
Average frames per second (FPS) is one of the most misleading and heavily abused performance metrics in PC gaming. A modern gaming rig can display a reassuring, high-frequency counter of 144 FPS in the top-left corner of your monitor while the actual gaming experience feels choppy, unresponsive, jerky, and erratic during crucial firefights. The culprit is not your average frame rate; it is frame-time variance, erratic frame pacing, devastating 1% and 0.1% lows, and micro-stutters caused by CPU main-thread starvation, DirectX 12 render pipeline stalls, PCIe bus bandwidth bottlenecks, or asynchronous background driver interrupts.
At Game Vault Forum, established by founder Joel Ayuba (LinkedIn Profile | Company Page), our Hardware Lab evaluates gaming systems using empirical, microsecond-accurate telemetry rather than subjective visual impressions. When diagnosing PC performance anomalies, proving to a game developer, hardware manufacturer, or tech support technician that a game is stuttering requires repeatable, scientifically captured frame-time telemetry. This comprehensive masterclass and checklist provides the exact empirical methodology, mathematics, and diagnostic workflows needed to capture, isolate, analyze, and conclusively prove frame-time stutter on Windows 11.
Title: Empirical Frame-Time Capture Matrix
Badge: Key Diagnostics
- Average FPS Fallacy: A 144 FPS average can conceal 200ms frame-time freezes because 143 frames rendered at 3ms plus one stalled frame at 420ms still mathematically averages ~144 FPS over a two-second window.
- True Stutter Threshold: Any frame-time deviation exceeding ±3ms from the display's hardware refresh baseline (e.g., 6.94ms for 144Hz) is perceptible to human vision; spikes exceeding 25ms create severe visual hitching.
- 1% Lows vs. 0.1% Lows: 1% lows reveal systemic hardware bottlenecks (GPU fillrate, VRAM limits); 0.1% lows expose transient interrupt spikes (shader compilation, DPC latency, storage I/O paging).
- The Definitive Toolkit: PresentMon 2.0+ (capturing GPU Busy vs. CPU Wait) and CapFrameX coupled with Event Tracing for Windows (ETW).
---
1. The Physics of Frame Pacing: Why Arithmetic Averages Lie
To understand stutter, we must understand the fundamental physical relationship between refresh rate, frame times, and human visual perception. A gaming monitor is a digital raster display that refreshes its physical liquid crystals or organic diodes at fixed or variable intervals.
When your monitor operates at 144 Hz, it refreshes the physical image once every 6.94 milliseconds:
```
Frame-Time (ms) = 1000 / Refresh Rate (Hz)
- 60 Hz = 16.67 ms per frame
- 120 Hz = 8.33 ms per frame
- 144 Hz = 6.94 ms per frame
- 240 Hz = 4.17 ms per frame
- 360 Hz = 2.78 ms per frame
- 540 Hz = 1.85 ms per frame
```
If your graphics card delivers a newly rasterized frame to the display buffer exactly every 6.94 milliseconds, your brain perceives flawless, continuous motion. This is known as perfect frame pacing.
However, if your system renders ten frames at 3.0ms each, but the eleventh frame stalls on an uncompiled DirectX 12 Pipeline State Object (PSO) for 65.0ms, your display buffer is starved of new data. The monitor has no choice but to re-scan the previous static frame for multiple consecutive refresh cycles. To the player's eye, the game visually halts, and the crosshair micro-teleports across the screen. Despite this agonizing hitch, an in-game FPS counter that averages frames over a one-second rolling window will calculate:
```
10 frames in 30ms + 1 frame in 65ms = 11 frames in 95ms
Projected Rolling Average: ~115 FPS
```
The player felt a noticeable 65ms hitch, but the on-screen overlay reported smooth triple-digit frame rates. This is why raw average FPS is functionally meaningless when diagnosing game smoothness.
---
2. Statistical Definitions: Percentile Lows vs. Low Averages
When presenting benchmark logs in technical dispute tickets or community forums, precision in terminology separates credible analysis from amateur speculation.
1% Lows (99th Percentile Frame Time)
The 1% low is calculated by ordering every recorded frame time during a benchmark run from fastest to slowest. The slowest 1% of frames are isolated. In classical statistical benchmarking, this is reported either as:
1. The 99th Percentile Frame Time: The exact frame duration (e.g., 14.2ms) below which 99% of all rendered frames fall.
2. The 1% Low Average: The arithmetic mean frame rate of all frames falling in the slowest 1% bracket.
A healthy system running at 144 FPS average should maintain a 1% low of at least 100 to 115 FPS (under 9.0ms frame time). If your 1% low drops below 60 FPS while your average is 144 FPS, your system is suffering from pronounced micro-stuttering during camera movement or heavy combat scenes.
0.1% Lows (99.9th Percentile Frame Time)
The 0.1% low represents the single slowest frame out of every 1,000 frames rendered. In a typical two-minute benchmark run generating 15,000 total frames, the 0.1% low captures the 15 absolute worst hitching events. This is where catastrophic stutters reside:
- Sudden shader compilation hitches
- Operating system background thread preemption
- Deferred Procedure Call (DPC) driver latency spikes
- High-resolution texture paging over the PCIe bus due to VRAM overflow
If your average is 165 FPS and your 0.1% low collapses to 12 FPS (an 83ms frame-time spike), your gaming experience is fundamentally broken regardless of how impressive your average FPS counter appears.
---
3. The Windows 11 Presentation Pipeline and DWM Mechanics
Windows 11 utilizes the Desktop Window Manager (DWM) to compose all desktop visual elements. For PC gamers, understanding the presentation mode reported by the graphics pipeline is critical:
1. Hardware Legacy Fullscreen (Exclusive Fullscreen / FSE): The game took direct control of the display output buffer. While this offered minimal input lag in legacy Windows 7 and 10 builds, modern Windows 11 features have superseded it.
2. Modern Flip Presentation Model (DirectFlip / Independent Flip): In Windows 11, running games in Borderless Windowed mode with the modern Flip model allows the game engine to bypass DWM composition entirely. The graphics driver queues frame buffers directly to the display scanout hardware through Multi-Plane Overlays (MPO).
3. Composed Flip: If an overlay (such as third-party recording software, Discord, or unoptimized overlays) intercepts the presentation queue, Windows 11 drops down to Composed Flip. In this degraded state, DWM must composite the game window into the desktop buffer, introducing unpredictable frame pacing ripples and added latency.
To capture pristine frame-time data, your logging tool must confirm that your game is running in Hardware: Independent Flip or Hardware: DirectFlip.
---
4. Setting Up Your Diagnostic Telemetry Stack
To generate verifiable frame-time traces that withstand peer review, you must utilize specialized kernel-level event tracing software:
Recommended Tool 1: CapFrameX
Built on Intel's open-source PresentData library, CapFrameX captures frame times with microsecond precision via Event Tracing for Windows (ETW). It automatically calculates:
- Arithmetic Average FPS
- 1% Low and 0.1% Low (Percentile & Average)
- P95 and P99 Frame Times
- Stuttering Percentage (proportion of total session time spent in frames exceeding 2.5x the average frame time)
Recommended Tool 2: Intel PresentMon (Version 2.0+)
PresentMon 2.0 introduced the groundbreaking metric GPU Busy. By comparing `Frame Time` against `GPU Busy`, you can instantly determine whether a stutter occurred on the GPU or the CPU:
- GPU Busy Equals Frame Time: The graphics card is 100% saturated and is the sole factor determining frame pace.
- Frame Time Exceeds GPU Busy: The GPU finished rendering its commands early and sat idle waiting for the CPU to dispatch the next draw call. A sudden spike in Frame Time where GPU Busy remains flat is absolute proof of a CPU or engine thread stall.
---
5. Designing a Statistically Valid, Repeatable Benchmark Route
A frame-time log is meaningless if it cannot be replicated. You cannot simply play a random multiplayer match and claim proof of stutter, because dynamic player actions, random smoke grenade placements, and unpredictable network packet drops introduce unrepeatable variables.
Follow our lab's standardized route creation protocol:
1. Fixed Starting Point: Stand character in a specific corner or doorway where geometry loading is complete.
2. Fixed Movement Trajectory: Follow an identical path (e.g., sprint down a straight corridor for 30 seconds, execute a 90-degree left turn, vault over a barrier, and pan camera smoothly 360 degrees).
3. Automated Macro or Fixed Analog Sweep: If possible, use a gamepad with a locked thumbstick tilt or an automated keyboard macro to eliminate human mouse acceleration variance.
4. Duration: Exactly 60 seconds or 120 seconds. Avoid short 10-second runs which fail to capture background memory garbage collection sweeps.
5. Multi-Run Triplication: Perform the exact same route three consecutive times. Discard the first run if you are testing for shader compilation stutter, or compare Run 1 directly against Run 3 to observe cache warm-up.
---
6. Reading the Oscilloscope: Decoding Frame-Time Spikes by Anatomy
When inspecting a continuous frame-time capture in CapFrameX, PresentMon, or hardware telemetry analyzers, the geometric profile of the plot provides undeniable forensic evidence of what failed in your hardware or software pipeline. Rather than guessing, hardware engineers classify frame-time signatures into four distinct anatomical profiles:
title: Oscilloscope Waveform Forensics: Decoding Frame-Time Anatomy
badge: Signal Diagnostics
- Guillotine Spike Signature: A single catastrophic vertical excursion from a 6.94ms baseline leaping directly to 65ms–200ms for 1–2 discrete frames, followed by an immediate return to baseline. Confirms synchronous main-thread blocking during Pipeline State Object (PSO) shader compilation.
- Sawtooth Ripple Signature: Rhythmic cyclic wave oscillation peaking at 35ms–55ms every 3–8 seconds across open-world traversal. Indicates VRAM oversubscription causing PCIe bus thrashing between GPU GDDR and system DDR5 memory.
- High-Frequency Micro-Jitter (Grass Pattern): Continuous erratic baseline noise fluctuating between 7ms and 24ms. Diagnoses DPC latency spikes, USB polling interrupts (4KHz/8KHz mice), or conflicting RGB motherboard background polling threads.
- Staircase Step Plateau: Symmetrical jumps to 16.6ms or 33.3ms intervals. Indicates double-buffer V-Sync falling back to lower refresh harmonic steps due to missed vertical refresh intervals.
| Waveform Signature | Visual Amplitude | Typical Duration | Frequency Profile | Primary Architectural Root Cause | Immediate Verification Action |
| :--- | :--- | :--- | :--- | :--- | :--- |
| Isolated Guillotine Spike | 50ms – 250ms+ | 1 to 2 frames | One-off on new asset render | Shader PSO Compilation Stall | Re-trigger identical action; hitch will disappear on second attempt. |
| Sawtooth Ripple Oscillation | 25ms – 60ms | 2 to 5 seconds | Periodic during camera pan | VRAM Over-Allocation & PCIe Paging | Drop texture resolution 1 notch; watch VRAM dedicated allocation drop. |
| High-Frequency Grass Jitter | 12ms – 28ms | Sustained continuous | 500ms to 1000ms cycles | DPC Latency / Sensor Polling Daemons | Terminate RGB monitoring software (iCUE, Armoury Crate); run LatencyMon. |
| Staircase Step Hitch | 16.6ms / 33.3ms | Multi-frame plateau | Synchronized with monitor refresh | Double-Buffer V-Sync Refresh Fallback | Enable G-Sync/FreeSync VRR and set an FPS limiter 3–4 FPS below refresh. |
title: Frame-Time Delivery Thresholds & Stutter Budgets
badge: Frame Pacing
note: Milliseconds required per frame. Lower values indicate smoother gameplay; spikes exceeding 25ms cause visible motion stutter.
240Hz Esports Target: 4.17 ms | 4.17 | emerald | 240 FPS Perfect Cadence
144Hz Smooth Baseline: 6.94 ms | 6.94 | cyan | 144 FPS Target Delivery
60Hz Standard Baseline: 16.67 ms | 16.67 | indigo | 60 FPS Target Baseline
Acceptable 1% Low Limit: 11.11 ms | 11.11 | amber | Minor Pacing Variance
Visible Stutter Spike: 33.33 ms | 33.33 | rose | Half-Refresh Drop (30 FPS)
Severe Engine Hitch: 65.00 ms | 65.00 | red | Major Shader / Asset Stall
Diagnostic Signature A: The Isolated Guillotine Spike
- Visual Pattern: A flat 6.9ms baseline with a sudden, vertical jump to 50ms–200ms for exactly one or two frames, immediately followed by a return to baseline.
- Underlying Cause: Asynchronous DirectX 12 or Vulkan shader compilation. The render thread hit an uncompiled Pipeline State Object (PSO) and halted execution until the CPU compiled the SPIR-V bytecode into machine instructions.
- Proof Criterion: Repeat the exact same visual trigger (e.g., cast the same spell again). If the spike disappears entirely, the culprit is 100% confirmed as shader compilation.
Diagnostic Signature B: The Sawtooth Ripple
- Visual Pattern: Rhythmic rises and falls in frame times occurring every few seconds while moving through open-world terrain.
- Underlying Cause: Video Memory (VRAM) exhaustion. The game allocated more VRAM than your physical GPU buffer possesses (e.g., allocating 13.5GB on a 12GB GPU). The DirectX Graphics Infrastructure (DXGI) is thrashing textures across the PCIe bus into system RAM.
- Proof Criterion: Check GPU Dedicated Memory Allocation in MSI Afterburner. If usage sits at 99% of dedicated VRAM, lower Texture Resolution by one tier. If the sawtooth ripple flattens, VRAM thrashing is conclusively proven.
Diagnostic Signature C: The High-Frequency Grass Pattern
- Visual Pattern: A thick, noisy baseline where frame times jitter continuously between 5ms and 18ms rather than holding a crisp, clean line.
- Underlying Cause: Deferred Procedure Call (DPC) latency, ultra-high mouse polling rates (4,000Hz/8,000Hz) starving the Windows scheduler, or background RGB hardware monitoring utilities (Asus Armoury Crate, Corsair iCUE, Razer Synapse) polling motherboard sensor buses every 500ms.
- Proof Criterion: Close all background system utilities and run LatencyMon. If `nvlddmkm.sys` or `ndis.sys` reports DPC execution times over 1000 µs, background driver contention is degrading your frame pacing.
---
7. Comprehensive Diagnostic Metrics Reference Table
| Telemetry Metric | Ideal Target | Acceptable Tolerance | Critical Stutter Indicator | Root Cause Diagnosis |
| :--- | :--- | :--- | :--- | :--- |
| Average Frame Time | 6.94 ms (144 Hz) | ±0.5 ms | > 16.67 ms (< 60 FPS) | General GPU compute saturation |
| 1% Low Frame Time | < 8.5 ms (> 117 FPS) | < 11.1 ms (> 90 FPS) | > 20.0 ms (< 50 FPS) | CPU bottleneck or memory latency |
| 0.1% Low Frame Time | < 12.0 ms (> 83 FPS) | < 16.6 ms (> 60 FPS) | > 33.3 ms (< 30 FPS) | Severe hitching / Shader stall |
| Max Frame-Time Spike | < 14.0 ms | < 22.0 ms | > 50.0 ms | Rendering pipeline hard freeze |
| GPU Busy vs. Frame Time | Delta < 0.2 ms | Delta < 1.0 ms | Delta > 8.0 ms | CPU thread stall / Engine desync |
| VRAM Dedicated Usage | < 85% capacity | < 92% capacity | > 96% capacity | PCIe bus texture thrashing |
| DPC Execution Time | < 250 µs | < 500 µs | > 1000 µs | Background driver / USB interrupt stall |
---
8. The 10-Point Frame-Time Verification Checklist
Follow this checklist sequentially to document and validate your stutter claim before publishing benchmark logs or submitting bug tickets:
1. Lock Hardware Frequencies: Set GPU core and memory clocks to a fixed profile via MSI Afterburner. Disable dynamic CPU power throttling in Windows Power Options by selecting High Performance or Ultimate Performance.
2. Verify Memory Sub-System: Confirm in CPU-Z that XMP / EXPO is enabled and operating in Dual-Channel 1:1 gear ratio. Unstable secondary memory timings (especially tRFC and tREFI) are a prime cause of unexplained 0.1% low collapse.
3. Enforce Windows 11 Gaming Hygiene:
- Turn Windows Game Mode ON (prioritizes active thread scheduling).
- Ensure Hardware-Accelerated GPU Scheduling (HAGS) is enabled for DLSS 3 / Frame Generation titles.
- Disable Xbox Game Bar background DVR recording.
4. Configure Display Variable Refresh Rate (VRR):
- Enable G-SYNC / FreeSync in GPU Control Panel.
- Set global driver V-Sync to ON.
- Turn in-game V-Sync OFF.
- Set an FPS cap 3 to 4 FPS below maximum monitor refresh (e.g., 141 FPS on a 144Hz panel).
5. Warm Up System Thermals: Run the game for ten minutes prior to logging to ensure GPU and CPU reach steady-state equilibrium (typically 65°C–78°C). Cold chips clock higher initially, which skews early benchmark minutes.
6. Execute Initial Diagnostic Run (Run 0): Traverse the benchmark path once to load assets and write initial shaders into the DirectX shader cache.
7. Initiate Official Benchmark Logging (Run 1 & Run 2): Trigger CapFrameX / PresentMon logging upon crossing the starting checkpoint. Maintain the standardized movement path for precisely 120 seconds.
8. Export Raw CSV Data: Save the complete microsecond frame-time timestamp log. Do not rely solely on screenshot summaries; technical engineers require the raw time-series CSV data.
9. Calculate Frame-Time Deviation:
```
Stutter Index = (Max Frame Time - Median Frame Time) / Median Frame Time
```
If your Stutter Index exceeds 3.5, your system possesses statistically verified hitching.
10. Cross-Check with Hardware Telemetry: Correlate frame-time spike timestamps against GPU Usage, CPU Thread #0 Usage, VRAM Allocation, and Disk Active Time to pinpoint the responsible subsystem.
---
9. Real-World Case Studies
Case Study A: Cyberpunk 2077 Dogtown Traversal
- Symptom: 120 FPS average in Pacifica, collapsing into 18ms frame-time spikes when crossing the checkpoint into Dogtown.
- Analysis: PresentMon revealed that `GPU Busy` dropped from 7.8ms to 3.2ms while `Frame Time` spiked to 24.5ms. The GPU was starved for work.
- Root Cause: The massive increase in ambient NPC AI routines and volumetric lighting in Dogtown overloaded CPU Thread 0. Disabling background streaming applications and setting Crowd Density to Medium resolved the 0.1% low collapse.
Case Study B: Counter-Strike 2 Smoke Particle Hitch
- Symptom: Silky 280 FPS average on an RTX 4080, but pushing through high-tier volumetric smoke grenades triggered a sharp 35ms spike.
- Analysis: CapFrameX logs showed an isolated guillotine spike occurring only on the first smoke grenade detonation per game map.
- Root Cause: DirectX 12 volumetric particle shader compilation. Increasing the driver Shader Cache size to 10GB allowed Windows 11 to permanently retain compiled smoke shaders across map reloads.
For additional hardware diagnostics, calculate real-time performance profiles with our FPS Calculator, verify game hardware prerequisites in our PC Game Requirements Checker, and discuss custom cooling and overclocking in the Game Vault Community Forum.